Introduction to Demography #
Demography - the study of populations #
- This includes populations of all sorts – animate or inanimate.
- A population is a group of individuals that is homogenous in some way such that there is a method of joining the group and a method of leaving the group.
- We will discuss populations themselves, and also the individuals within the populations, and mostly we will be talking about people.
- Even when discussing human populations, there are many kinds of individuals who may be involved, for example: female people, Australian people.
Importance #
Actuaries are interested in the study of populations because much of an actuary’s work is involved in predicting how a population group evolves.
For example, when actuaries sets the premiums for
- life insurance: they need to know what the probability is that the insurance benefit will have to be paid at any time – what the likelihood of the policyholder dying at a particular time is.
- here, we want to build a model for exiting the population of the live people
- superannuation: they may need to model when an employee will retire
- here, we want to build a model for exiting the population of the employees by entering the population of the retirees (excluding the exit cause death)
- here, we have what we call “multiple decrements”
Outline #
-
Here we focus on analysis at the population (as opposed to individual) level
- What are human population characteristics?
- Sex ratio
- Child-woman ratio
- Dependency ratio (age dependency ratio, youth dependency ratio)
- How do populations evolve?
- Rate of change
- What are human population characteristics?
-
We will look at probabilities for individuals to
- leave – mortality rates
- enter – fertility rates
the (human) population later (week 7).
-
Later (week 7), we will also briefly discuss models used for `population projections’ - which enable us to form a view on what a population will look like in the future, based on the behaviour of the individuals within it.
Characteristics of a population #
General populations #
-
Any population has a number of features which are characteristic.
-
For our purposes, a population is group of individuals that is homogeneous in some way, such that there is
- (at least) one method of joining the group, and
- (at least) one method of leaving it.
-
We also need to know what we mean by `homogeneous’ – at least one way of recognising why an individual belongs to this group.
- For example, you are all enrolled in ACTL10001, so that could be a criterion;
- You can join and leave by enrolling / unenrolling.
National populations #
- When we consider the population of a country. We can group the individuals in the population by
- age, or age range,
- gender,
- health conditions,
- incomes,
- smoking status, marital status, etc.
- Individuals join the group by
- being born, or
- immigrating.
- They leave by
- dying, or
- emigrating.
- We can construct a profile of the country using these characteristics.
Sources of Information #
- Census data
- in Australia, conducted every 5 years
- comprehensive, but expensive
- Population surveys
- sample surveys
- limited amount of information, but quick and cheap
- Registration data (e.g. marriage)
- quality is high, but scope is limited
- Company / organisation data
- Examples: social security register, insurance companies, state schools, pension funds,
- Insurance companies would collect data about their policyholders: age, gender, marital status, postcode, credit rating,
\(\ldots\) - Specific covers collect specific data:
- e.g. smoking status and health history for life insurance
- e.g. accident history, driving habits, value of car for car insurance
Summary statistics #
Introduction #
- There are a number of summary statistics commonly calculated and used to describe populations.
- Some statistics focus on a characteristic of the population at one point in time:
- Sex ratio
- Child-woman ratio
- Dependency ratio (age dependency ratio, youth dependency ratio)
- Labour force participation rate
- Some statistics focus on rates of change (discussed in the next section)
- crude rates (for whole population)
- specific rates (for a specific part of the population)
Sex ratio #
Definition #
We can calculate a sex ratio
- for the total population
- for any particular age
- for an age group.
It is calculated as $$ 100 \times \frac{\text{# males}}{\text{# females}}.$$
Sex ratio for the total population in 2020 (estimated) #
- The sex ratio for entire world population is 101.8
- The overall sex ratio for Australia is 99
- Furthemore, in Australia it is
- 106 at birth and for the 0-14 age bracket,
- 109 for the 15-24 bracket,
- 99 for the 25-54 bracket,
- 93 for the 55-54 bracket, and
- 86 for the 65+ bracket
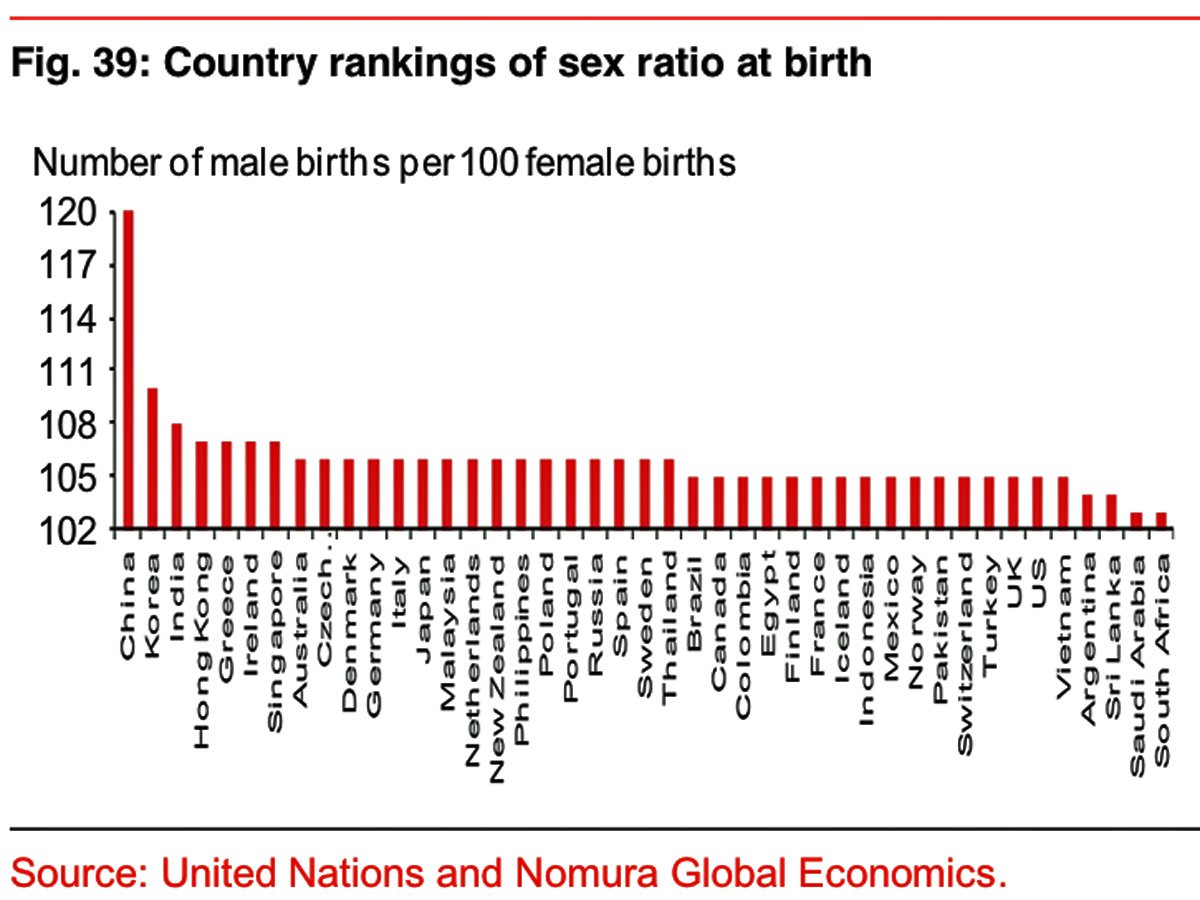
- The sex ratios vary a lot from country to country. According to UN 2015 data,
- the lowest two ratios are 83 (Djibouti) and 86 (Latvia, Hong Kong, Lithuania, Russia, Ukraine)
- the highest two are 256 (UAE), and 339 (Qatar).
Sources:
Sex ratio at birth-2015 #
Australia’s Population 2016 #
| Age | Males | Females | Persons |
|---|---|---|---|
| 0-4 years | 807,893 | 765,733 | 1,573,626 |
| 5-14 years | 1,539,667 | 1,459,304 | 2,998,971 |
| 15-49 years | 5,815,521 | 5,801,256 | 11,616,777 |
| 50-64 years | 2,124,112 | 2,205,170 | 4,329,282 |
| 65 years + | 1,715,846 | 1,956,405 | 3,672,251 |
| Total | 12,003,039 | 12,187,868 | 24,190,907 |
Source: Australian Bureau of Statistics, 2016 Census Tables
Sex ratio for Australian population in 2016 is
$$100\times\frac{12,\!003,\!039}{12,\!187,\!868}=98.48$$
Child–Woman Ratio (CWR) #
Definition #
-
The chid-woman ratio is calculated as the number of children (both males and females) in a population under a given age, typically 5, per 100 females in the population who are of reproductive age (typically taken as 15 to 49): $$ 100 \times \frac{\text{# children aged 0 to 4}}{\text{# females aged 15 to 49}}.$$
-
From our Australian population data we can calculate this per 100 women as
$$100\times \frac{1,\!573,\!626}{5,\!801,\!256 }=27.13.$$ -
This is a crude measure of fertility – we will review more refined measures later.
Dependency ratios #
Total dependency ratio #
- This is the number of economically dependent individuals (children (0-14] and seniors (65+)) per 100 individuals of working age (i.e., 15-64): $$100\times \frac{\text{# of children aged (0, 14]} + \text{# of seniors aged 65+}}{\text{# of individuals of age [15, 64]}} $$ “Economically dependent” may not be the best description for the 65+. More so, these are people who likely don’t have (tax paying) salaries any more, and are living off pensions or savings.
- From our Australian population data we can calculate this per 100 of economically viable persons as
$$100\times \frac{1,\!573,\!626+2,\!998,\!971+3,\!672,\!251}{11,\!616,\!777+4,\!329,\!282}=51.70$$This number was 49.58 for 2006.
Age dependency ratio #
-
This is the the number of seniors per 100 individuals of working age (economically viable persons): $$100\times \frac{\text{# of seniors aged 65+}}{\text{# of individuals of age [15, 64]}} $$
-
From our Australian population data, we can calculate this per 100 of economically viable persons as
$$100\times \frac{3,\!672,\!251}{11,\!616,\!777+4,\!329,\!282}=23.03$$ -
The age dependency ratio for 2006 was 19.92.
Age dependency ratio, country ranking 2015 #
- The top 5 ranked countries:
- Japan (43.32)
- Italy (35.08)
- Greece (33.43)
- Finland (32.41)
- Germany (32.24).
- In the middle:
- France (30.64), ranked 8th
- UK (27.55), ranked 20th
- Canada (23.77), ranked 28th
- Australia (22.71), ranked 30th
- USA (22.31), ranked 33rd
- China (13.05), ranked 66th
- The bottom 5 countries:
- Oman (3.36), Bahrain (3.17), Kuwait (2.60), Qatar (1.42), UAE (1.34)
Youth dependency ratio #
-
This is the number of children per 100 economically viable persons (i.e. of working age): $$100\times \frac{\text{# of children aged (0, 14]}}{\text{# of individuals of age [15, 64]}} $$
-
From our Australian population data we can calculate this per 100 of economically viable persons as $$100\times \frac{1,!573,!626+2,!998,!971}{11,!616,!777+4,!329,!282}=28.68. $$
-
Note that the sum of this and the Age Dependency Ratio gives the Dependency Ratio.
-
The youth dependency ratio for 2006 was 29.66.
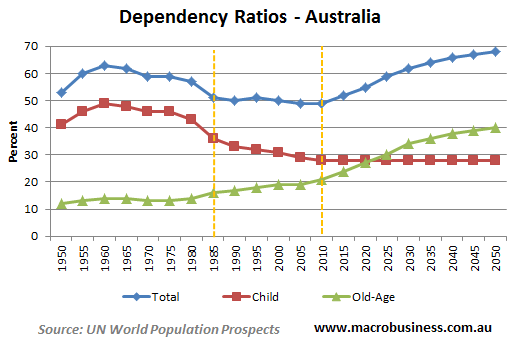
Trends of dependency ratios of Australia #
Rates of change #
Crude vs specific Rates #
- A single figure statistic, based upon the number of events per 1,000 of population, is called a crude rate
- A figure based upon the number of events per 1,000 of a specific section of the population and relating only to that section, is called a specific rate
Crude rates of migration #
Simply, we can describe the change in a population from time \(t\) to \(t+1\) in
this way:
\begin{eqnarray*} P(t+1) &=&P(t)+\text{Births}(t,t+1)-\text{Deaths}(t,t+1) \\ &&+\text{Immigrants}(t,t+1)-\text{Emigrants}(t,t+1) \end{eqnarray*}
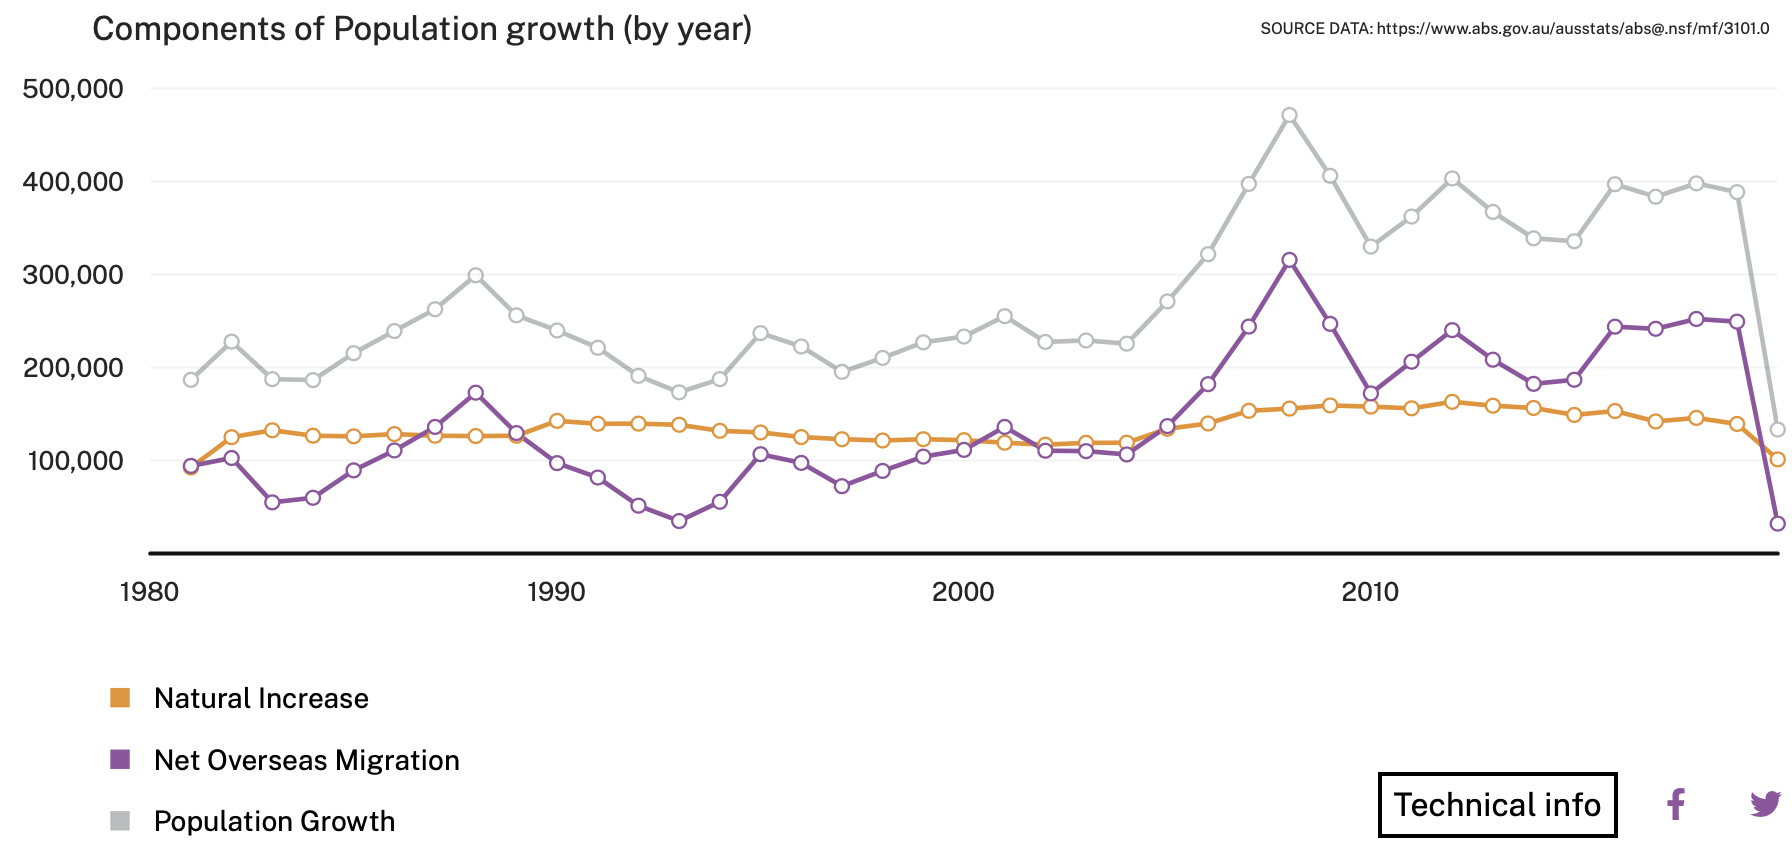
Some definitions:
- The natural increase in a population is Births
\(-\)Deaths. - The net migration in a population is Immigrants
\(-\)Emigrants. - The population growth is Natural Increase
\(+\)Net Migration.
The Australian Bureau of Statistics (ABS) website has a
population clock showing estimates of how Australia’s population is changing.
From the
ABS population clock:
On 20 August 2021 at 10:37:03 AM (Canberra time), the resident population of Australia is projected to be:
$$25,\!801,\!609$$
This projection is based on the estimated resident population at 31 December 2019 and assumes growth since then of:
- one birth every 1 minute and 43 seconds,
- one death every 3 minutes and 13 seconds,
- one person arriving to live in Australia every 1 minute and 30 seconds,
- one Australian resident leaving Australia to live overseas every 1 minutes and 26 seconds,
leading to an overall total population increase of one person every 4 minutes and 12 seconds.
These assumptions are consistent with figures released in
National, state and territory population.
From the
ABS population clock:
On 27 August 2020 at 04:56:06 PM (Canberra time), the resident population of Australia is projected to be:
$$25,\!653,\!866$$
This projection is based on the estimated resident population at 31 December 2019 and assumes growth since then of:
- one birth every 1 minute and 44 seconds,
- one death every 3 minutes and 15 seconds,
- one person arriving to live in Australia every 3 minutes and 58 seconds,
- one Australian resident leaving Australia to live overseas every 7 minutes and 5 seconds,
leading to an overall total population increase of one person every 2 minutes and 37 seconds.
These assumptions are consistent with figures released in Australian Demographic Statistics, December Quarter 2019 (cat. no. 3101.0).
Migration in Australia #
- Australia has had high net migration, especially in the post World War II period
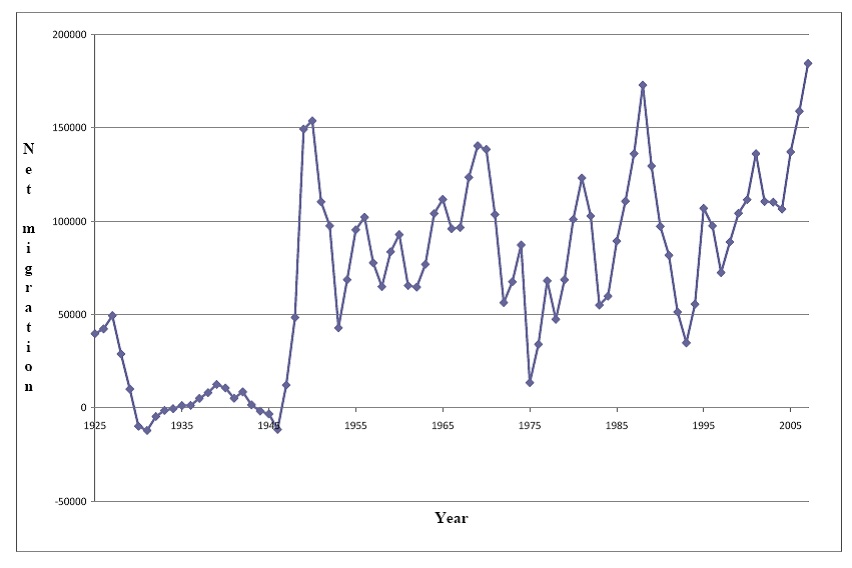
- Controlled migration is a way of stopping a population dying out, or building up numbers quickly, and may support economic growth
- It is also a way of controlling the age structure of the population, reducing the age dependency ratio.
- see also the
Australian migration and population dashboard
Crude rates of birth and death #
These are usually quoted as rates per 1,000 of population:
$$\text{Crude death rate} =1,\!000 \times\frac{\text{total number of deaths}}{\text{population size}}.$$
$$\text{Crude birth rate} = 1,\!000\times \frac{\text{total number of births}}{\text{population size}}.$$
Specific rates #
Specific rates are more `specific’ than crude rates: they are rates which apply to a particular class of individual, for example
- gender specific (rates for females or males),
$$\text{death rate for females} =1,\!000 \times\frac{\text{total number of female deaths}}{\text{total women population}}$$ - age specific (rates for a particular age range)
$$\text{death rate for seniors} = 1,\!000 \times\frac{\text{total number of deaths of age 65+}}{\text{total senior population}}$$ - class specific (e.g. smoker, married, etc)
$$\text{death rate for smokers} = 1,\!000 \times\frac{\text{total number of deaths from smokers}}{\text{total population of smokers}}$$
Example 1 - Comparing populations (crude rates) #
Here are some statistics for two human populations.
| Age group | Pop A | Deaths | Death rate | Pop B | Deaths | Death rate |
|---|---|---|---|---|---|---|
| 1 | 2,000 | 4 | 2.00 | 5,000 | 11 | 2.20 |
| 2 | 3,000 | 3 | 1.00 | 4,000 | 4 | 1.00 |
| 3 | 4,000 | 5 | 1.25 | 3,000 | 4 | 1.33 |
| 4 | 5,000 | 12 | 2.40 | 2,000 | 5 | 2.50 |
| Total | 14,000 | 24 | 14,000 | 24 |
The crude death rate for population A and B is the same:
$$\frac{24 \times 1,\!000}{14,\!000} = 1.7143$$
per thousand of population.
Standardised rates #
- In Example 1, can we then say that mortality rates are similar for populations A and B?
- Crude rates tell us nothing about the effect of the age distribution of the populations we are comparing.
- We can remove this effect if we use standardised death rates.
Example 1 - Comparing populations (standardised rates) #
- Let us continue with the data from Example 1.
- We will use the statistics for populations A and B to calculate the crude death rate for population B, standardised to population (structure) A.
- Procedure:
- Calculate age specific rates for both populations
- Apply age specific rates to the reference population
- Calculate standardised crude rate
- Compare mortality experience
- As a sample calculation, for Age Group 1, we apply the death rate for population B to the number of people in Age Group 1 in Population A, i.e. multiply 2,000 by 2.20.
| Age group | Pop A | Deaths | Death rate A | Death rate B | Exp deaths |
|---|---|---|---|---|---|
| 1 | 2,000 | 4 | 2.00 | 2.20 | 4.4 |
| 2 | 3,000 | 3 | 1.00 | 1.00 | 3.0 |
| 3 | 4,000 | 5 | 1.25 | 1.33 | 5.3 |
| 4 | 5,000 | 12 | 2.40 | 2.50 | 12.5 |
| Total | 14,000 | 24 | 25.2 |
- What can we conclude?
Demographic transition and population pyramids #
The Theory of Demographic Transition #
The theory of Demographic Transition is a theory about the way human populations change under the effects of economic development, as a society moves from `third world’ conditions of tribal nomadic or agrarian culture, into an industrial and urban society.
- increased and improved access to health services
- improved general nutritional and sanitary standards (e.g. clean water)
- immediate reduction in infant mortality rate, leading to sharp increase of population
- slower reduction in overall mortality rates
- more wealth then leads to a drop of fertility (less family support, cost of having children, birth control…)
- after some time, increased longevity, leading to an older population
These effects can be observed in the structure of population ages in a given society. This is what an population pyramid depicts.
Population pyramids #
A population pyramid (age-gender pyramid) is a diagram showing the gender and age distribution of a country or a region in a year.
Common features of population pyramids #
- For most populations:
- Higher numbers of male births than female births (sex ratio at birth is approximately 1.05).
- Higher mortality rates for males.
- Females are living longer than males.
- In the following slides, we review examples of the main types of pyramids:
- Triangular-shaped (undeveloped countries, rapid population growth)
- Beehive-shaped (developed countries, slow population growth)
- Rectanglar-shaped (aging population, stationary population)
- upside-down triangular-shaped (shrinking population)
- Shapes of the pyramids can be controlled by births, deaths and migrations.
- Social and economic changes result in changes in the distribution of populations. Over time, as a country develops, the shape changes from triangle shape to beehive shape, to barrel-like shape, to upside-down pyramid.
Economically Undeveloped Countries #
An example of such a country is Ethiopia in 2007.
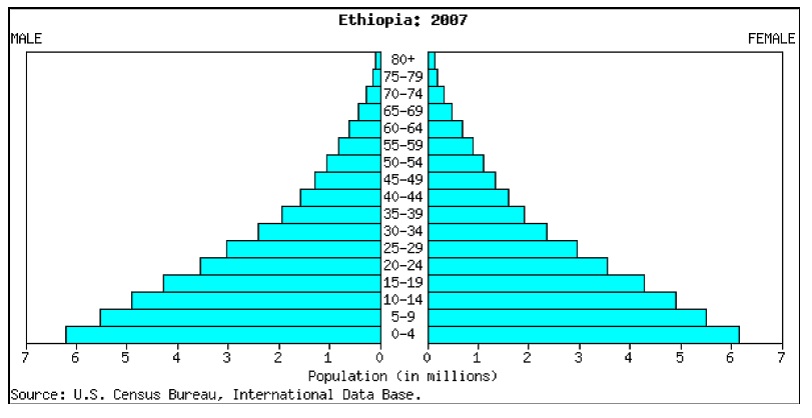
Population pyramid - Ethiopia #
The population is characterised by
- high proportion of the population in young age groups
- high fertility rates
- high mortality rates, especially infant and child mortality
- low life expectancy, age dependency ratio is low.
The pyramid has a wide base and a narrow top. The majority of the population is below age 15.
Population pyramids for other third world countries (low GDP, low quality of life, little medical care, inadequate food supply, poor water quality) generally have this shape.
Emerging economies #
An example of such a country is India in 2006.
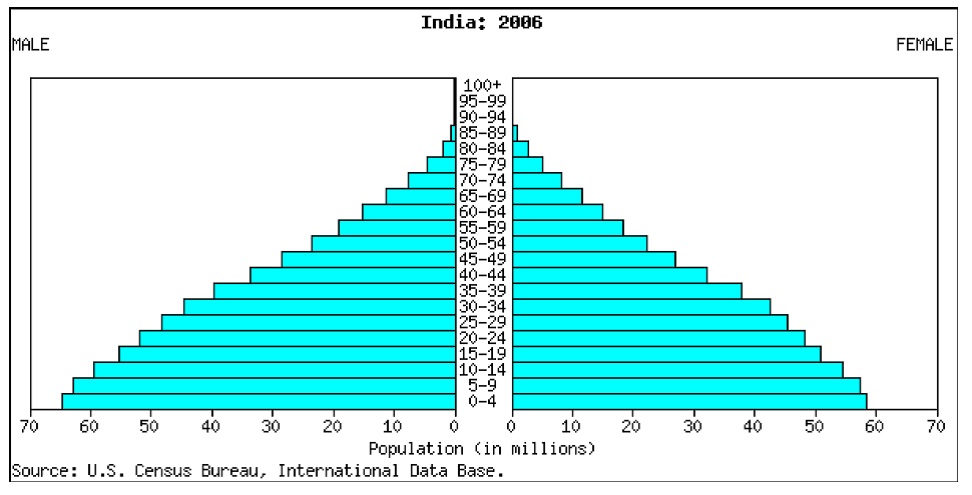
Population pyramid - India #
The population is characterised by
- lower fertility and child mortality than in under-developed countries
- improving mortality
- increasing maximum age
- higher life expectancy than that for Ethiopia
- Rapid population growth
The pyramid has a fatter middle than in the case of Ethiopia – a higher proportion of the population is surviving to reproductive ages.
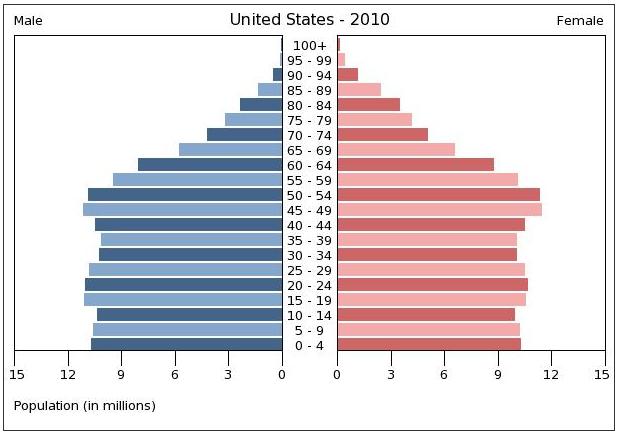
Established economies #
Examples are Australia, USA, UK, Canada, HK, Singapore, etc.
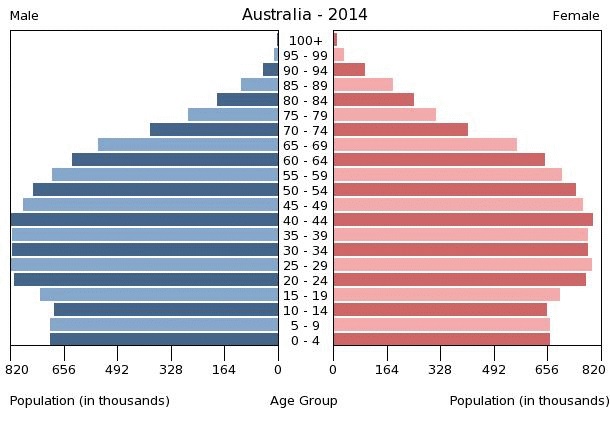
Population pyramid - Australia #
The population is characterised by
- high proportion in middle and higher age groups
- lower mortality at all ages
- lower fertility rates
- lower youth dependency ratio
- higher life expectancy
- population is growing slowly.
High quality of life, adequate health care, plenty of food supply and good water quality.
Countries with an ageing population #
An example is France
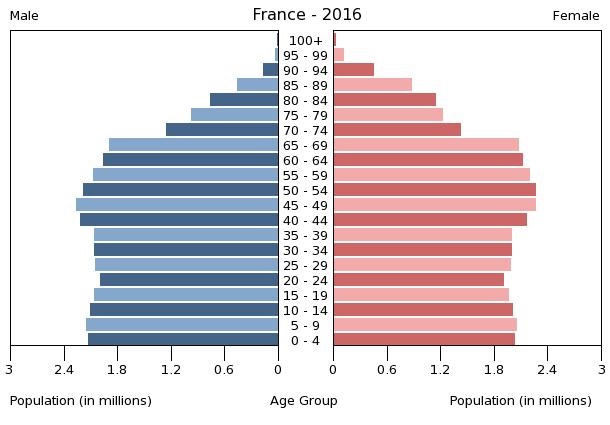
Population of France 2016 #
The population is characterised by
- low fertility rates, small base
- low mortality rates
- age distribution becoming even
- stationary population
- Nearly zero population growth
Upside-down pyramid #
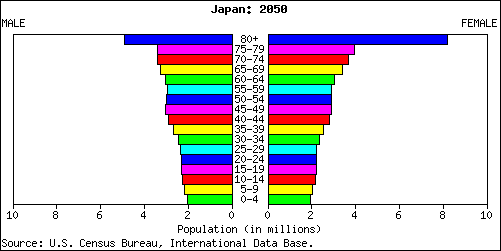
Upside-down pyramid #
- Ageing is happening all round the world in developed countries.
- This means that the age dependency ratio is increasing: tax payers are having to support a higher number of aged people per capita.
- old people are expensive to support – they usually require subsidised income support (aged pensions) and their health costs are much higher than even middle aged people
- improving mortality (i.e. lower mortality rates) means that people live longer, and are more likely to become chronically ill and require long term care
- health costs in the last year of life (in Australia) are about the same as for the WHOLE of the rest of the life
- There has been world wide debate on how to provide for old age because of this expected strain of increasingly aged populations. (Hence the introduction of compulsory superannuation saving in Aus.)
-
See also this short video on the implications on pension systems
Australian pyramid #
Population pyramids of Australia 1996 vs 2016 #
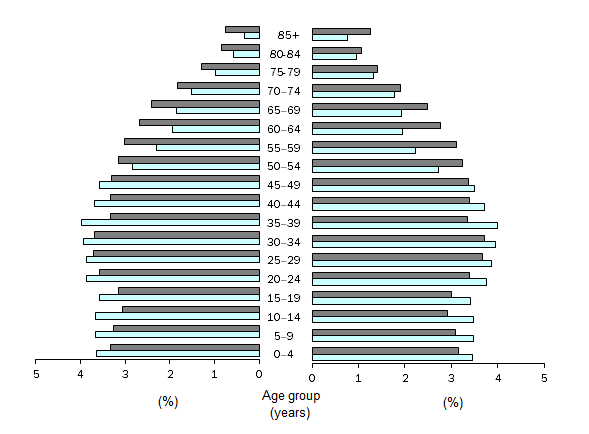
Population pyramids of Australia 1996 vs 2016 #
Questions:
- Which side represents males?
- Which color represents 2016 pyramid?
- Which year has longer life expectancy?
- which year has higher age dependency ratio?
- which year has higher youth dependency ratio?
References #
Atkinson, M. E., and David C. M. Dickson. 2011. An Introduction to Actuarial Studies. 2nd ed. Edward Elgar.